On-Site Traffic Data Collection
Measurement of saturation flows, Degree of Saturation and Underutilised Green Time in a simple mobile app.
Get the Latest Version
JCT TrafficTools is a free Android app that can be used to assist in on-site data collection.
With JCT TrafficTools, you can take site photographs, record vehicles on a lane-by-lane basis, and from that vehicle information TrafficTools can produce saturation flow measurements, DoS (Degree of Saturation) data, and UGT (Underutilised Green Time) measurements.
Once you’ve collected your data, TrafficTools can provide it in an Excel-compatible format and help you email your collected data, wherever you need it to go.
Other Details
- Compatible with Android 10 and up
- Privacy Policy
Quick-Start Guide
Collecting Saturation Flow Data
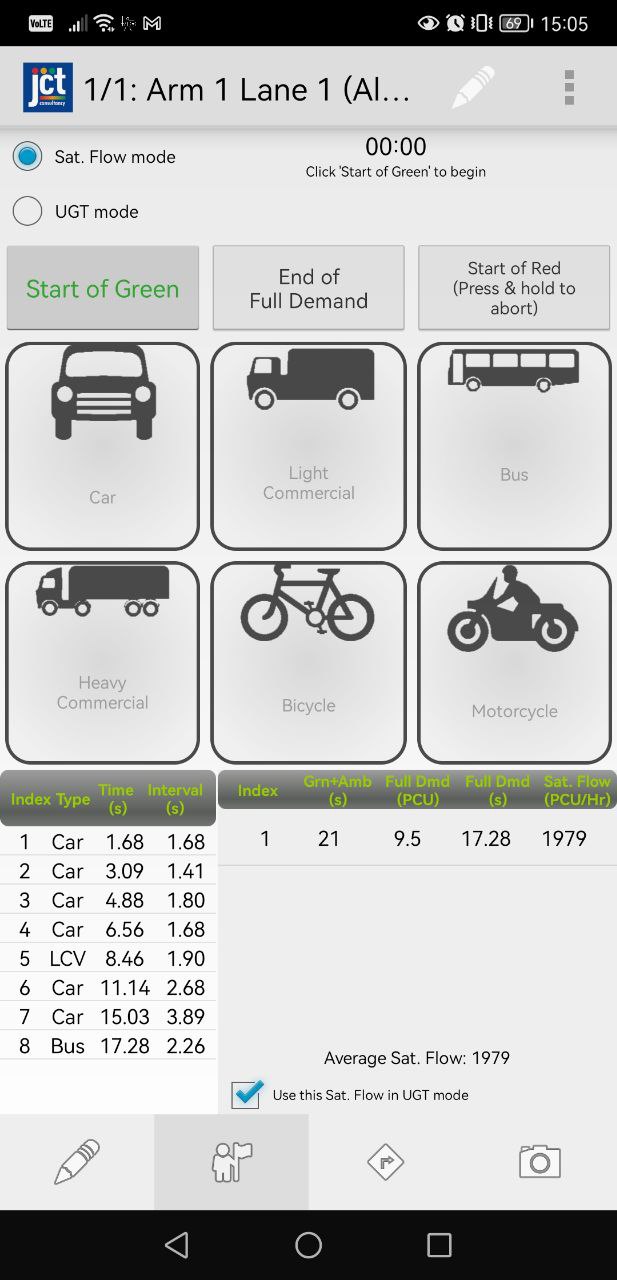
- Tap “Start of Green” when the green period starts.
- Tap the relevant vehicle button when the vehicle crosses the stop line.
- When full demand has ended (i.e. when the queue is fully discharged), tap “End of Full Demand”.
- Continue recording each vehicle as it crosses the stop line for the remainder of the green period.
- At the end of the green and amber periods tap “Start of Red”.
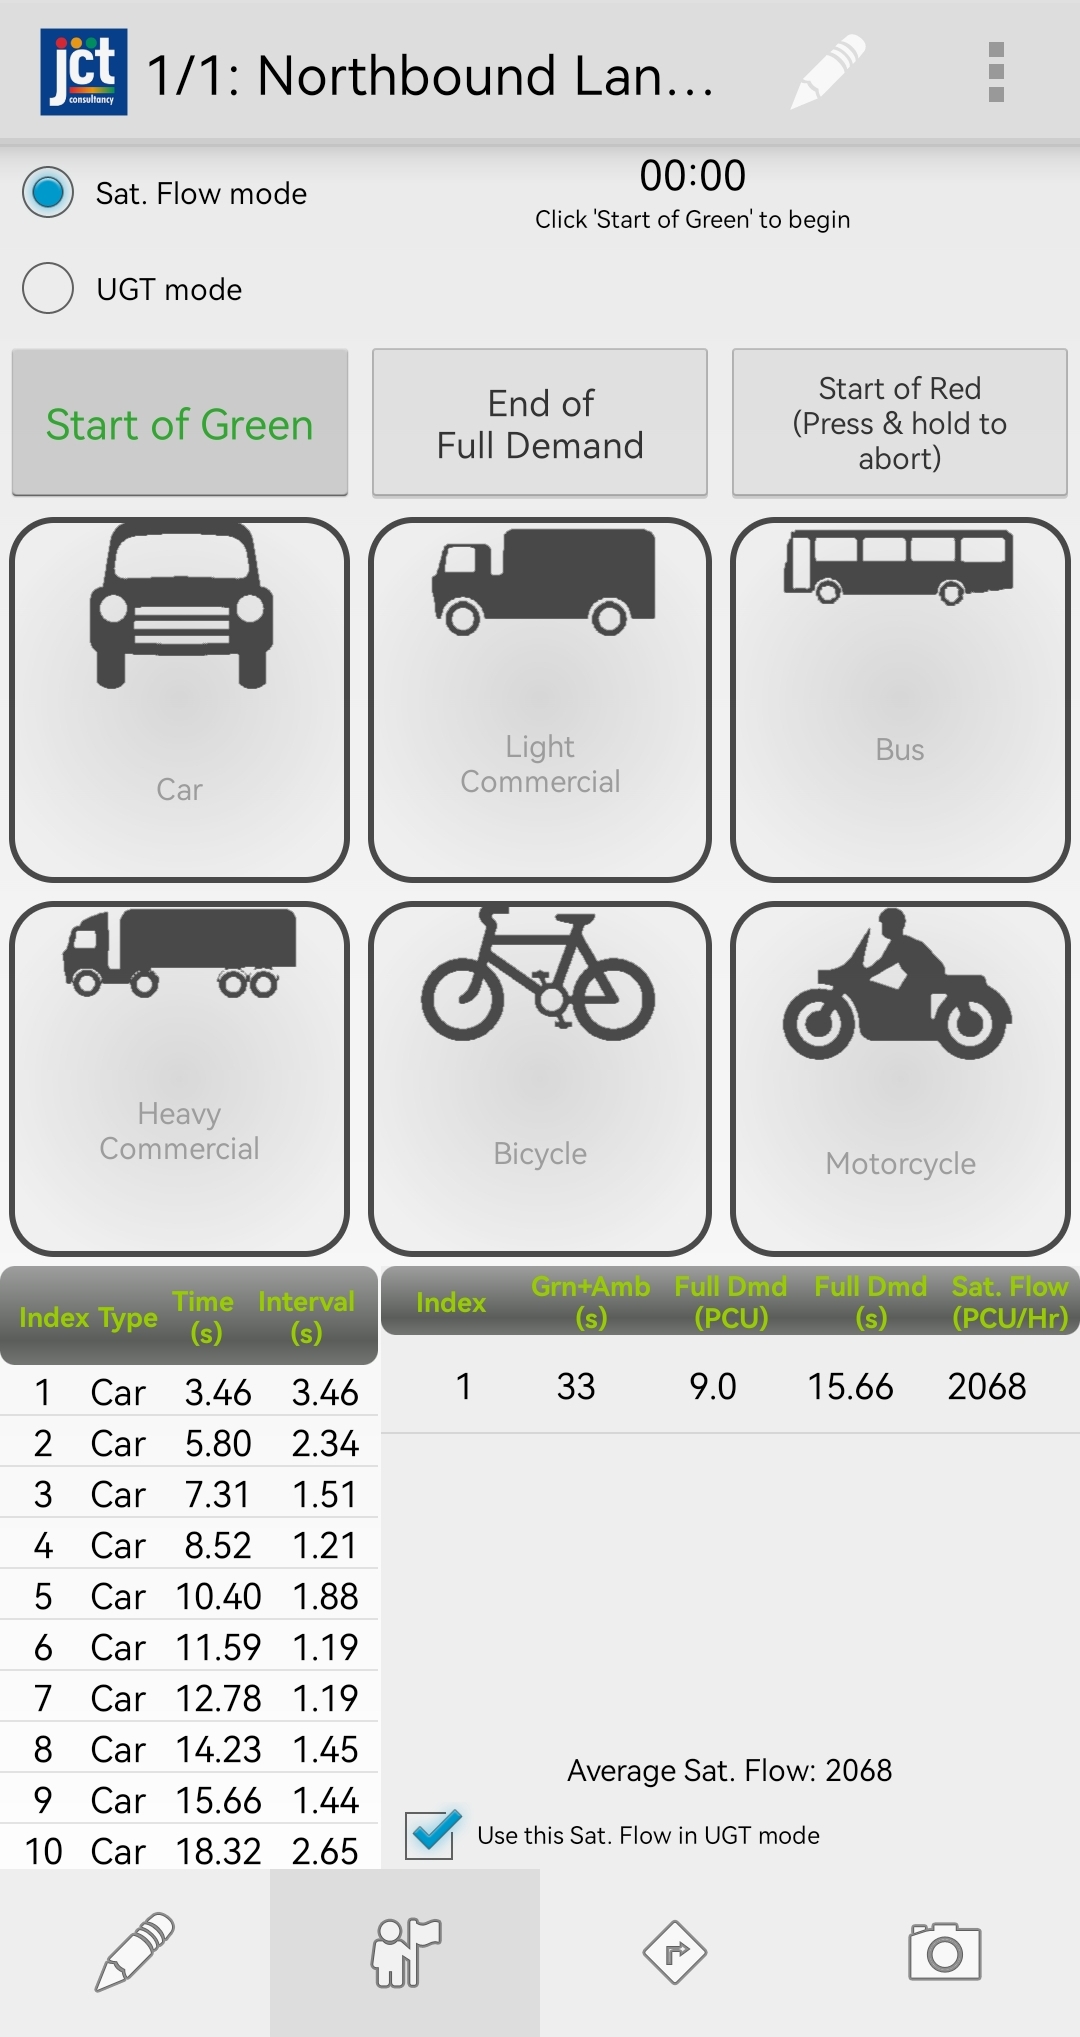
- A summary line for that green period is displayed showing the following:-
- Measured duration of green period
- Measured number of PCU during full demand
- Measured duration of full demand
- Calculated saturation flow
This process should be repeated to obtain as many counts as required. The average Saturation Flow over all the measured green periods is displayed at the bottom of the screen.
Tips
- Long-press on the “Start of Red” button to abort a count during the green period. No data collected during that green period will be stored.
- By tapping a count’s summary line, you can view the recorded vehicle data for that green period.
- Long-press on a count’s summary line to erase the count data for that green period.
- You can specify that the first few counted vehicles in each green period are ignored, to avoid any startup effects influencing the calculated Saturation Flow. This can be set in the Project Settings page.
Collecting data for Degree of Saturation (DoS) and Under-utilised Green Time (UGT) measurement
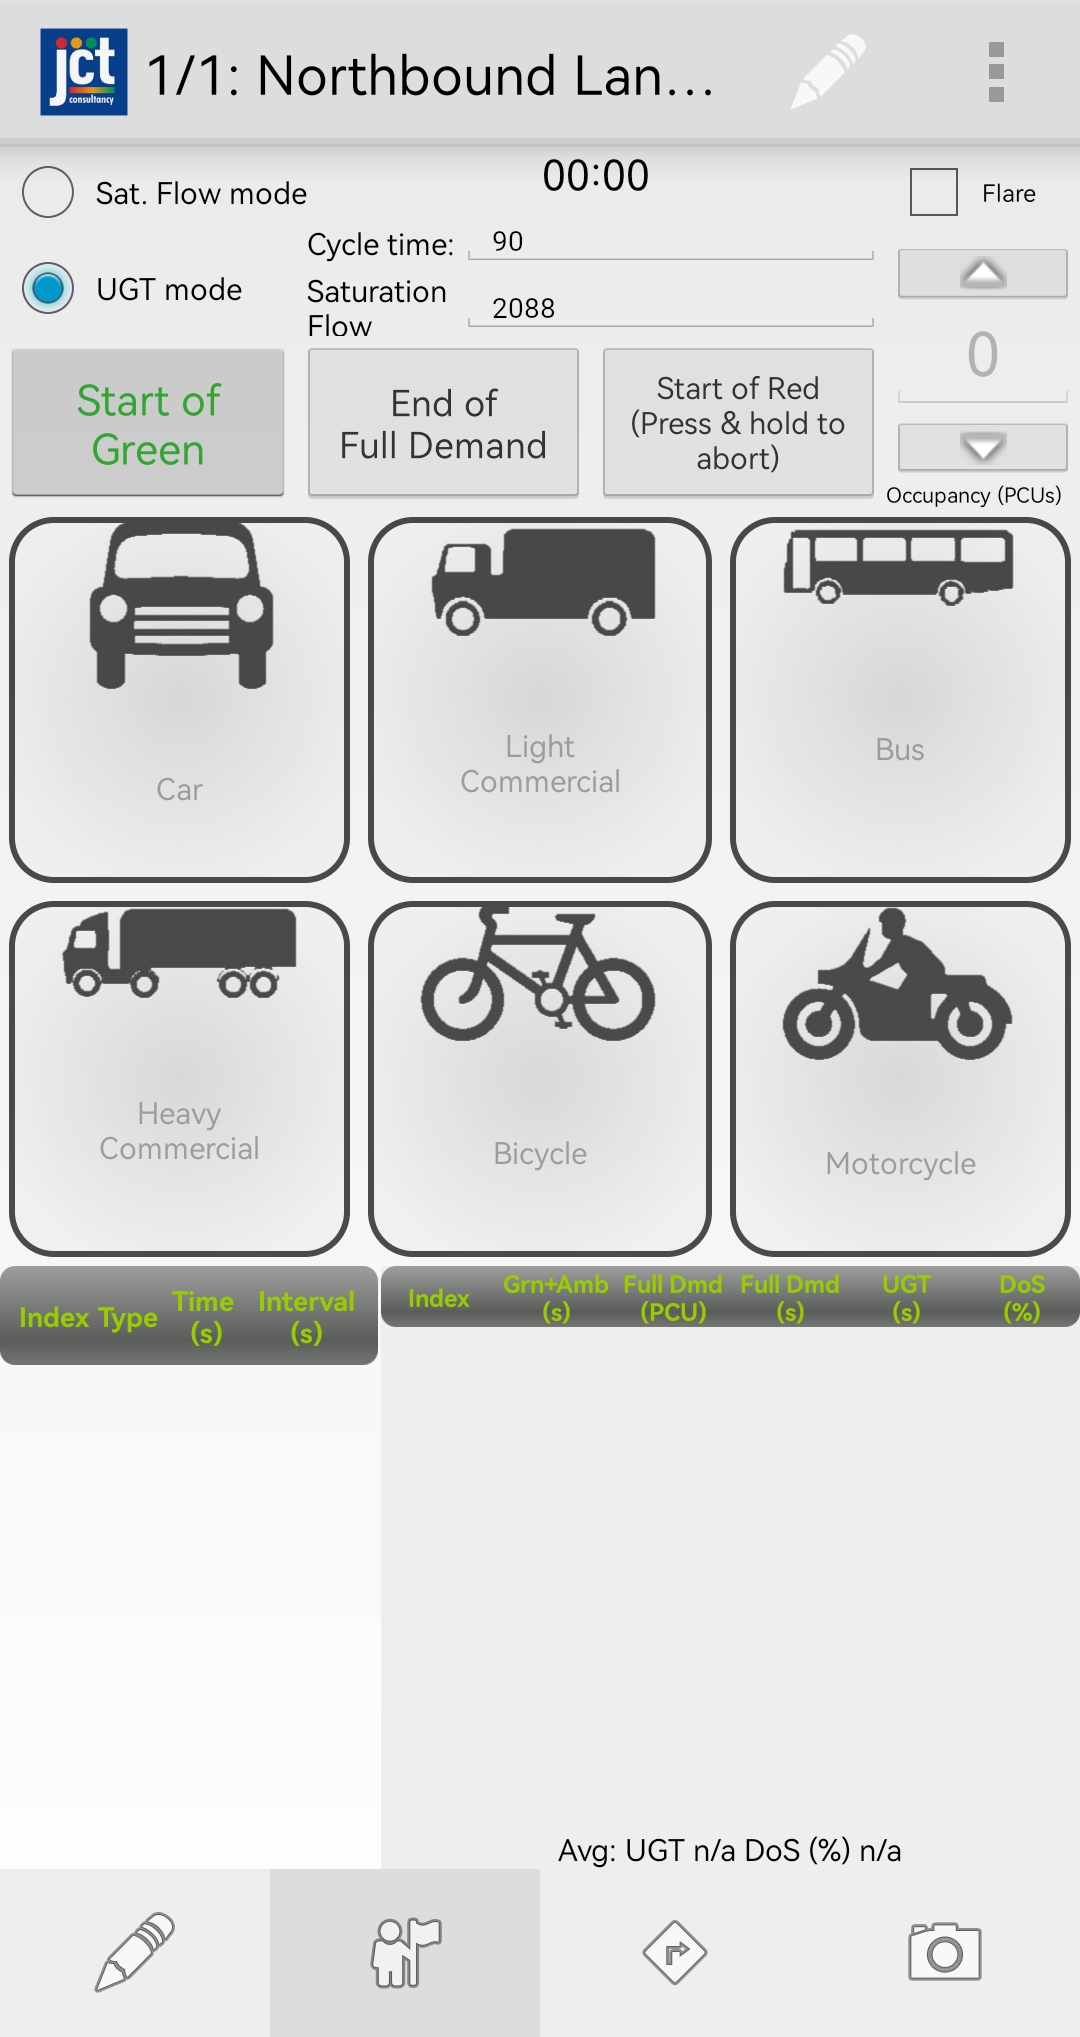
- Tap “UGT Mode” to switch to UGT and DoS calculation mode.
- Enter the Saturation Flow of the stop line.
- If required, enter the cycle time to record it with this data.
- Record the vehicles crossing the stop line during a green period in the same manner as described for measuring Saturation Flow.
- A summary line for that green period is displayed showing the following:-
- Measured duration of green period
- Measured number of PCU during full demand
- Measured duration of full demand
- Calculated amount of Under-utilised Green Time
- Calculated Degree of Saturation.
Tips
- If you’ve just completed a set of Saturation Flow measurements, the average measured Saturation Flow will be carried across to the Sat Flow entry field of UGT Mode.
- If a flare is present, tick the Flare tickbox and enter the occupancy of the flare for each green period.
- By tapping a count’s summary line, you can view the recorded vehicle data for that green period.
- Long-press on a count’s summary line to erase the count data for that green period.
- For Degree of Saturation calculations, the duration of the leaving amber can be changed in Project Settings
Recording data separately for multiple arms and lanes
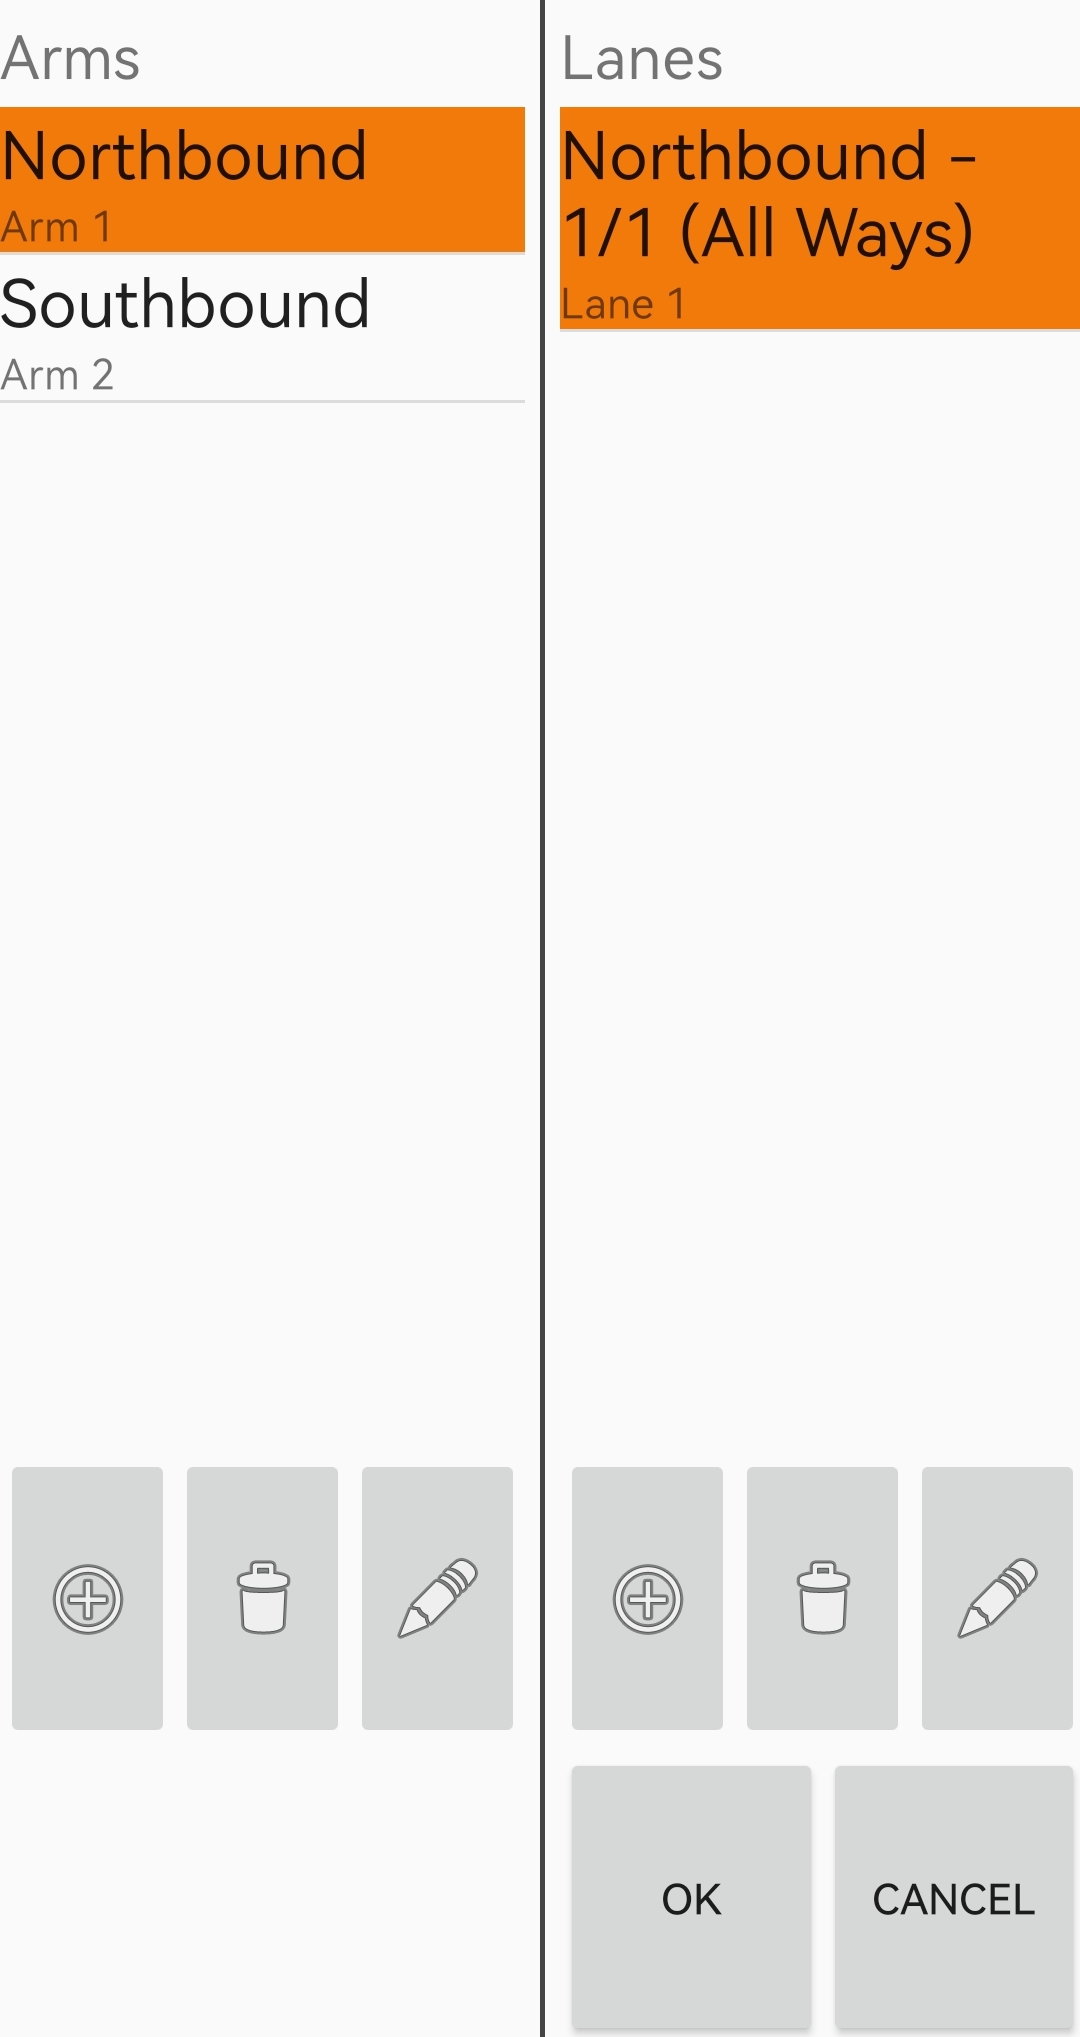
- Tap the Setup Lane icon at the top of the screen to enter the Lane Setup form.
- The left-hand panel is a list of all defined arms. You can edit this list with the buttons at the bottom.
- The right-hand panel is a list of all defined lanes for whichever arm is selected in the left-hand panel. You can edit this list with the buttons at the bottom.
- Tap the OK button to save your changes.
Tips
- The selected lane is the lane that is currently in use for data collection.
- Each arm and lane is automatically assigned a number. The number of the currently selected lane is displayed in the title bar at the top of the screen.
Editing project settings
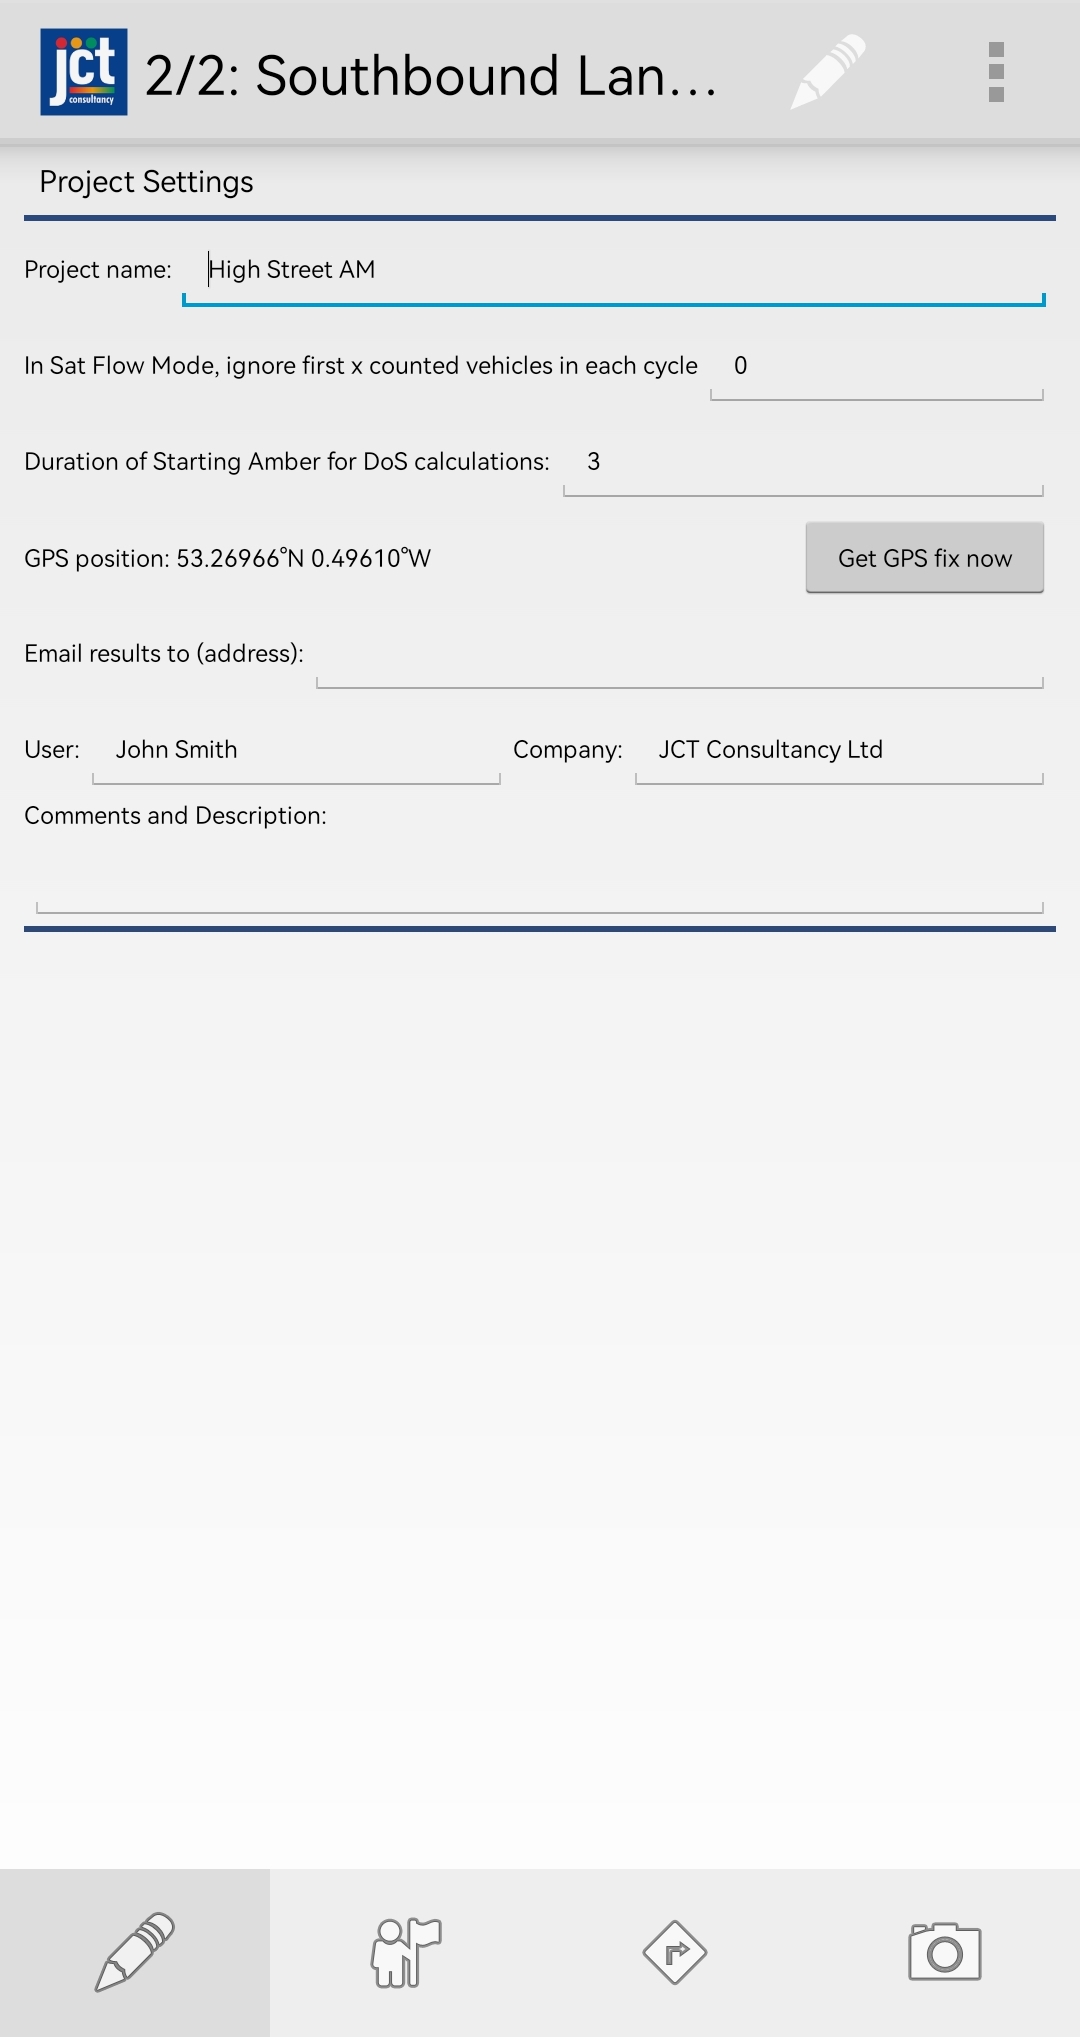
The Project Settings is the leftmost page. Here you can set the following:
- A project name.
- The duration of the leaving amber. Once data collection has begun, this cannot be changed.
- The number of vehicles to ignore at the start of green when performing Saturation Flow measurement.
- Obtain site location using the GPS facility in your phone/tablet if available.
- An email address where the project data should be emailed to. If this is left blank, you will be prompted to enter an email address when you choose to send it.
- Your name and company.
- Any comments or description that would be useful to note along with this project.
View a summary of all lanes and send all data by email
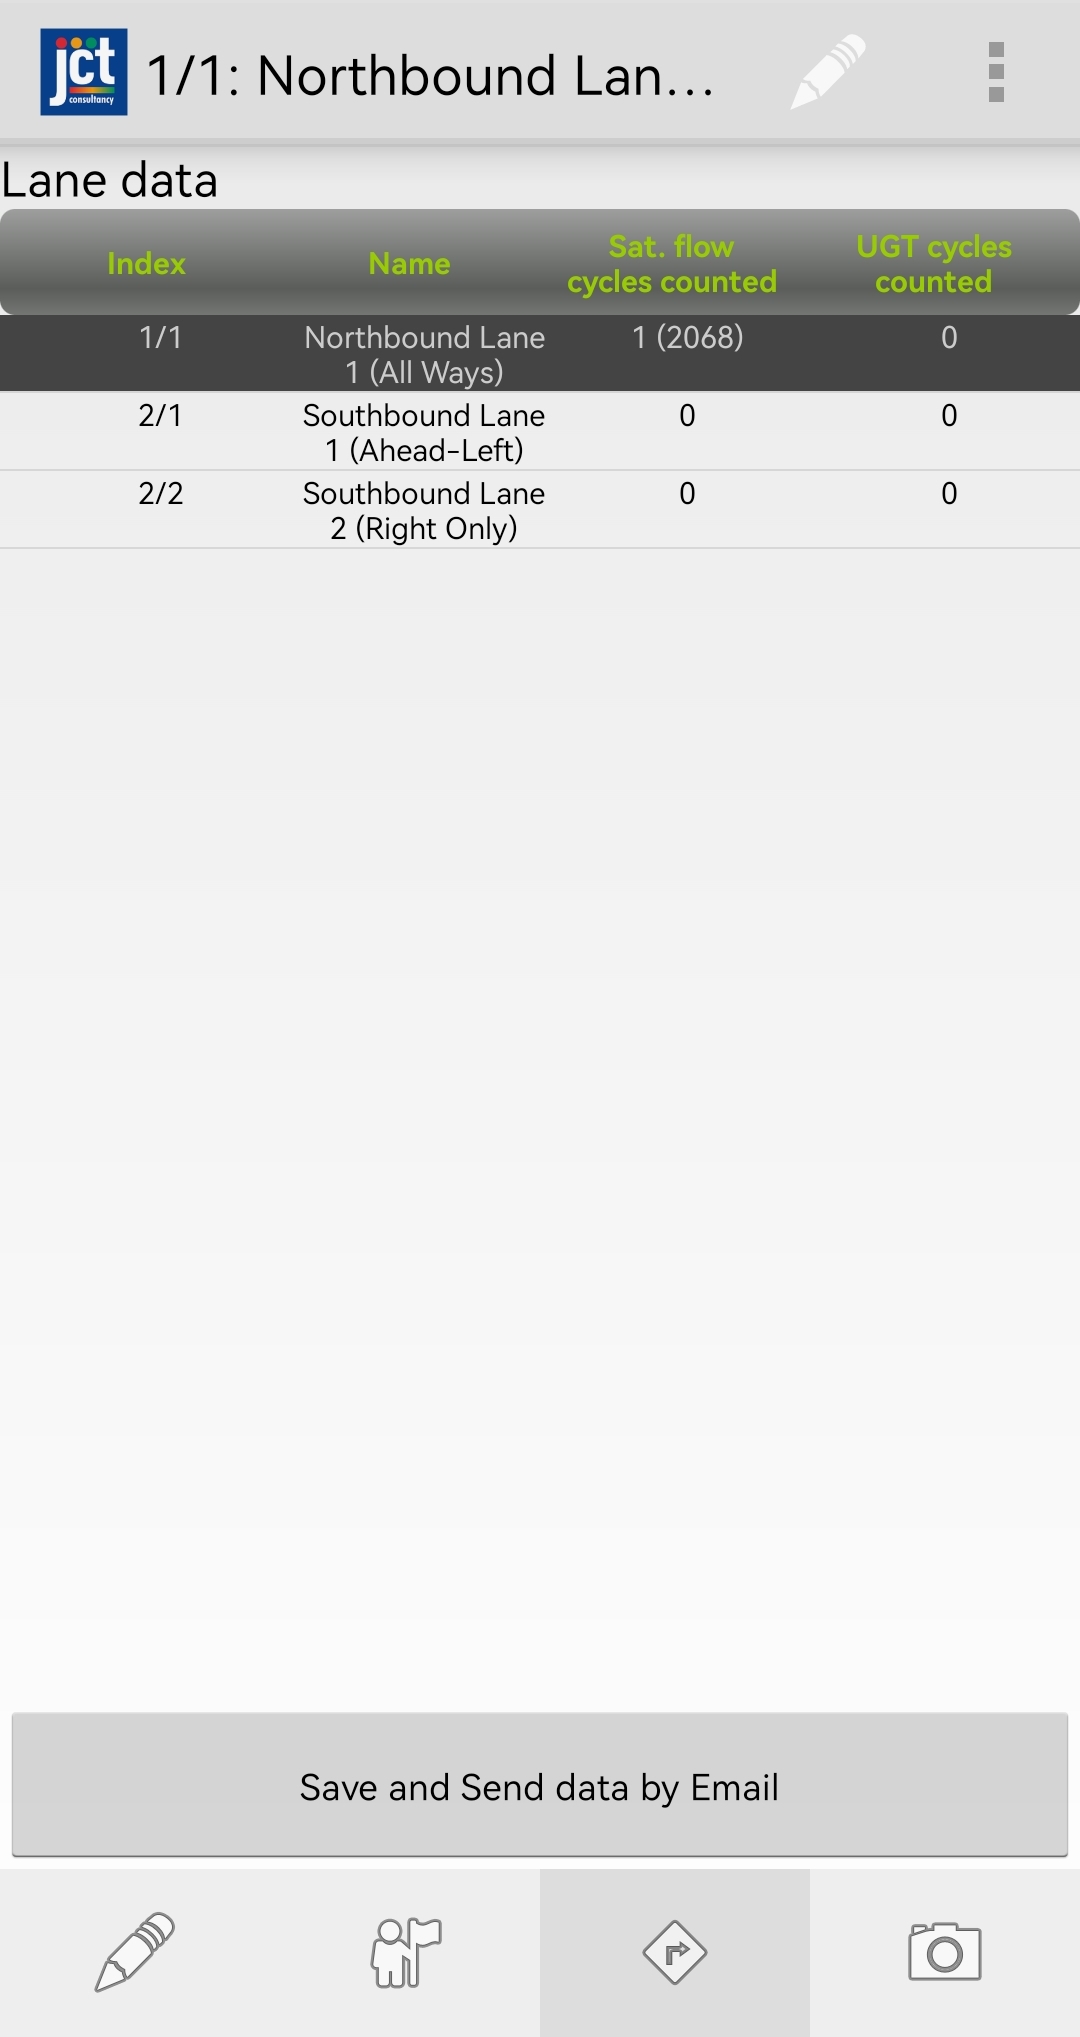
The Lane Data summary page lists all lanes along with the number of cycles that have been counted on each lane.
Tap the “Save and Send data by Email” button to send all project data via email.
Record site photographs with the project
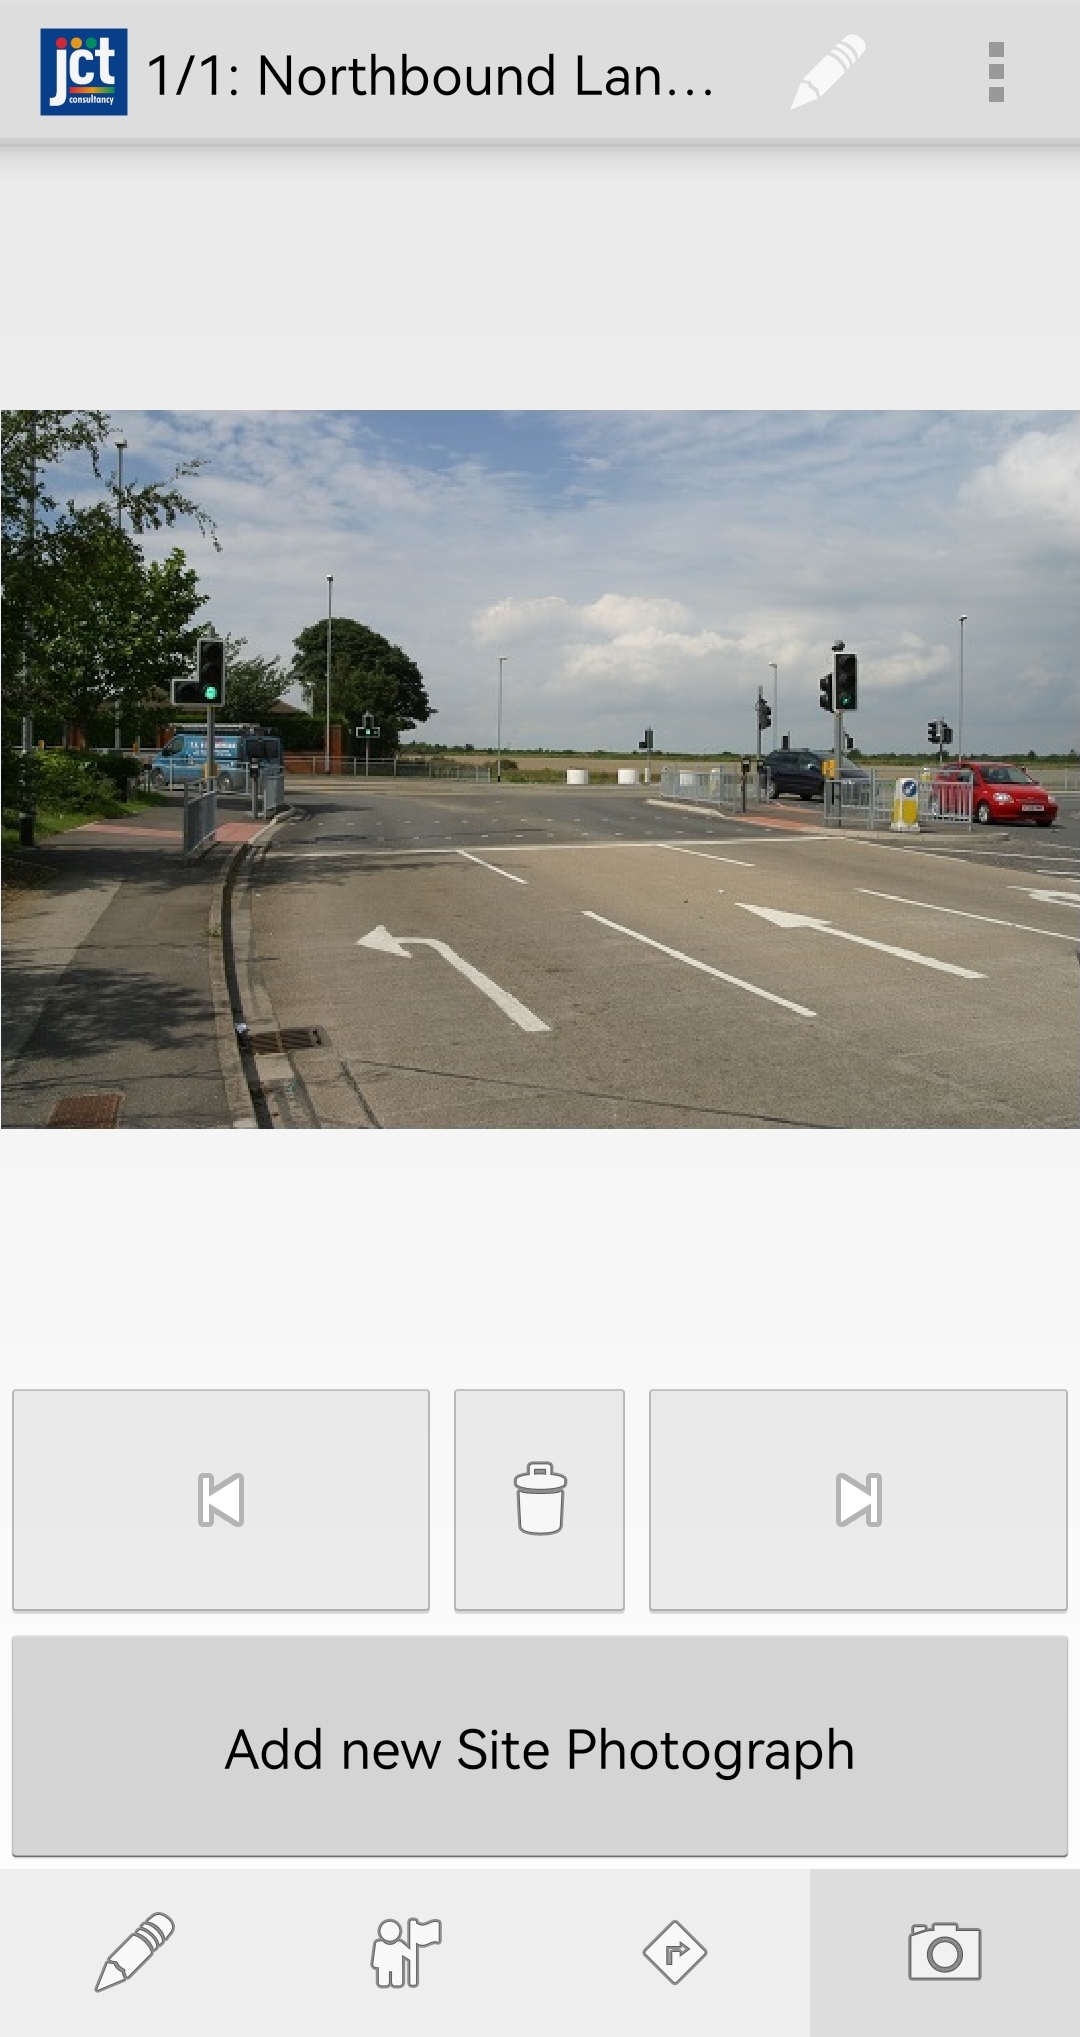
- Tap “Add new Site Photograph” to start the camera utility on your phone/tablet and take a photograph.
- You can take multiple photographs and use the Previous and Next buttons to view all the photographs in the gallery.
- All the photographs taken will be included in the project data that can be sent via email.
Save and load project data
Saving and loading the project is found under the overflow menu in the top-right corner of the screen.
- Save the project by selecting the Save or Save As menu option. You can choose to save your project to the JCT Traffic Tools Home Folder in your phone/tablet’s internal memory, or alternatively you can save to a folder in your SD Card if available
- Load a previously saved project by selecting the Load menu option.
- Start a new project by selecting the New Project menu option.
- Delete a previously saved project by selecting the Delete menu option.
Email your project data
- You will first be prompted to save your project.
- Select an email address to send to if you have not already done so in the Project Settings
- A data file in MS Office XML format. This file can be opened in Microsoft Excel and includes the collected data in spreadsheet format.
- A data file in a plain XML format. This file contains all the collected data in a machine-readable format should you wish to post-process the data in any way.
- An XML Project File. This is the file that is saved and loaded by the JCT Traffic Tools app and is in a proprietary format.
- An image attachment for each site photograph taken.
Edit application preferences
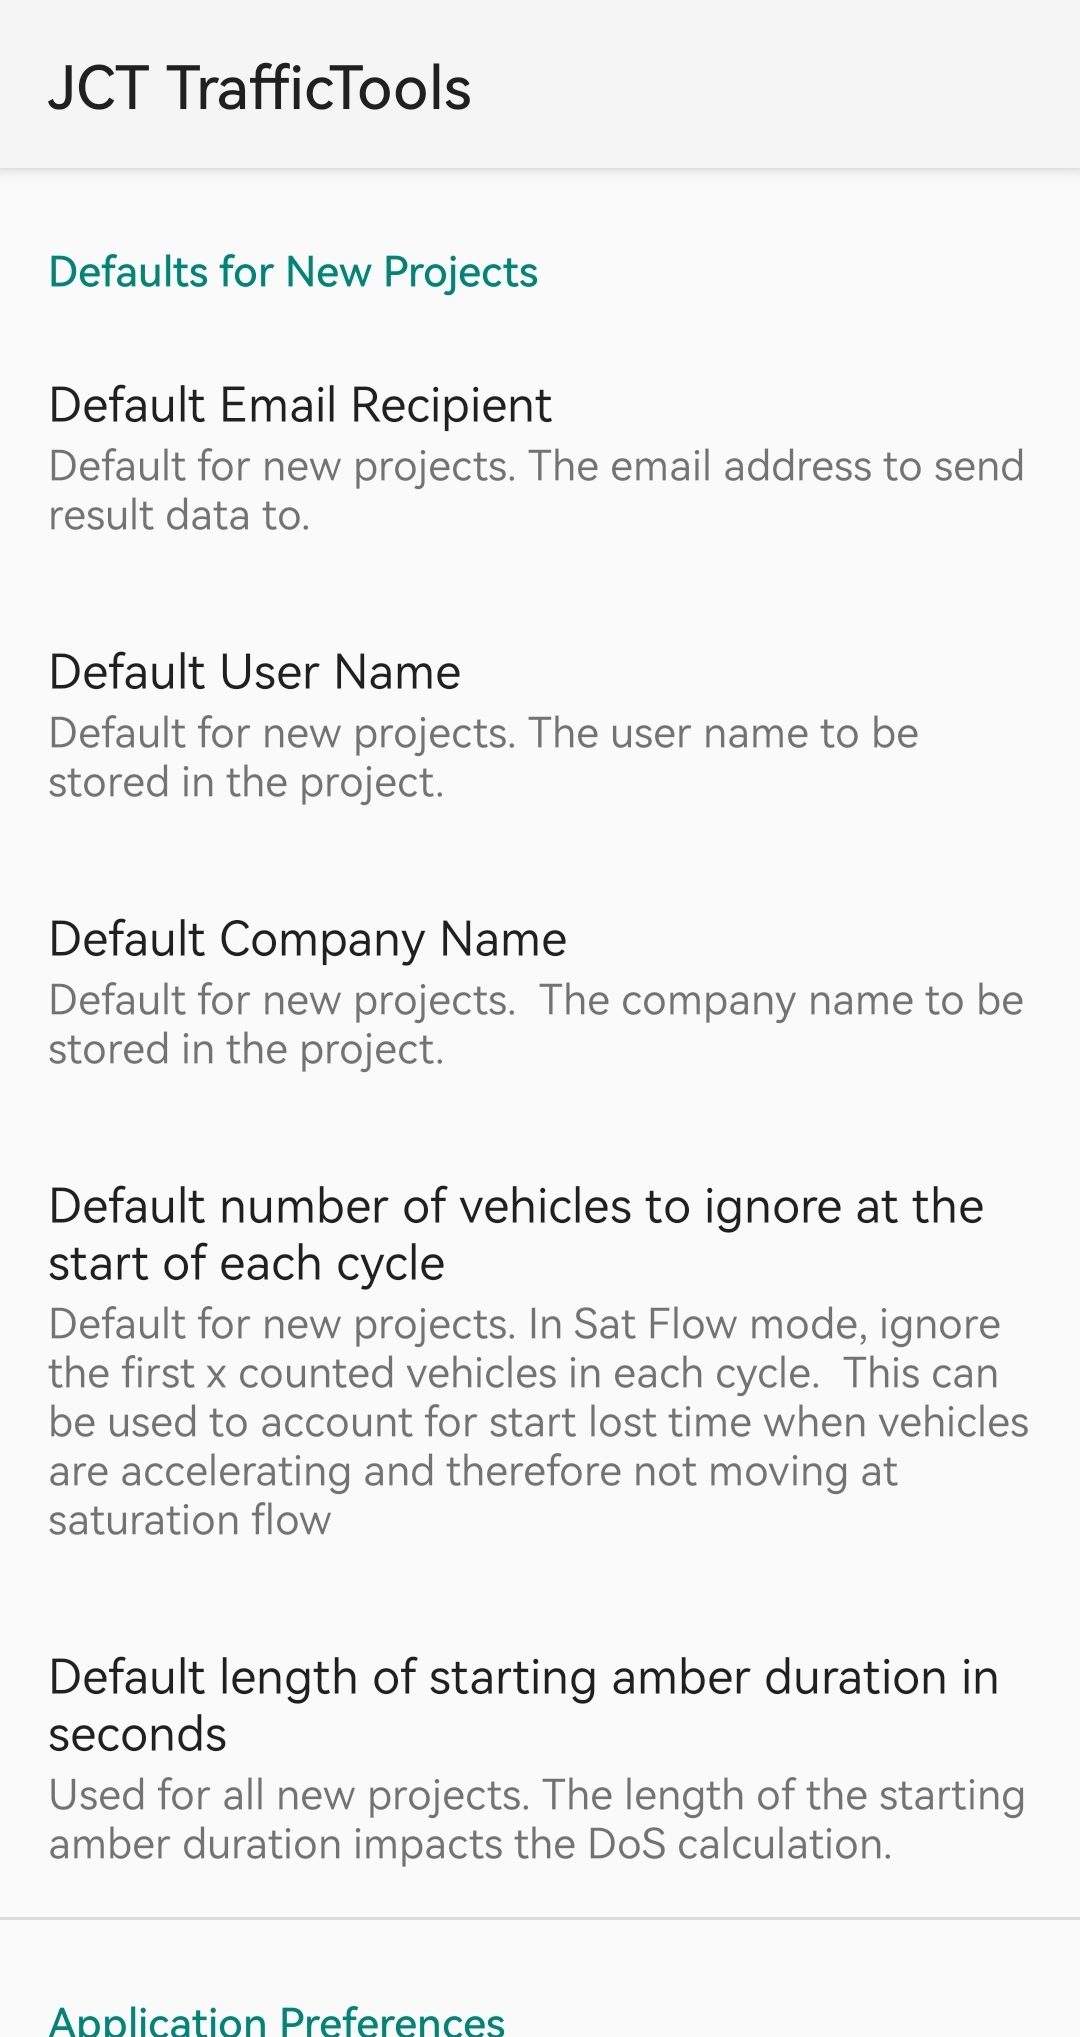
Tap the Options setting in the overflow menu in the top-right corner to access the application preferences.
- Defaults for new projects – Set the defaults to ensure that all new projects have these settings by default.
- Lock application to Landscape/Portrait Mode – Select to ensure the application doesn’t automatically switch orientation when the phone/tablet is rotated or placed flat.
- High Contrast Mode – Select to switch the display to a high contrast mode that may be more suitable to viewing outdoors.
- Vehicle to PCU conversion – This lists the Vehicle to PCU conversion factors that are used by JCT Traffic Tools. These are currently not editable.